


Our Schools
Working in close collaboration, the three schools of the Pembroke School District to provide educational services to approximately 1346 students from kindergarten to twelfth grade. Pembroke Hill School is the elementary school, working with k-4 and the Three Rivers School is the middle school focusing on grades 5-8. Pembroke Academy serves as the regional high school for SAU, serving the towns of Allenstown, Chichester, Epsom, Pembroke, and tuition students from the surrounding area.
2025 iReport Data from the State of New Hampshire
Pembroke Hill School
-
Cost Per Pupil: $23,038
-
Total Expenditures: $7,239,764
-
Educators Certified in the Subject: 100%
-
Experienced Educators: 93%
-
Average Class Size: 18.5

2025 iReport Data from the State of New Hampshire
Three Rivers School
-
Cost Per Pupil: $22,682
-
Total Expenditures: $6,455,361
-
Educators Certified in the Subject: 96%
-
Experienced Educators: 96%
-
Average Class Size: N/A

2025 iReport Data from the State of New Hampshire
Pembroke Academy
-
Cost Per Pupil: $18,873
-
Total Expenditures: $13,514,377
-
Educators Certified in the Subject: 83%
-
Educators on an Intern Path: 1%
-
Experienced Educators: 96%
-
Average Class Size: N/A

Assessment Data: 2014-2025
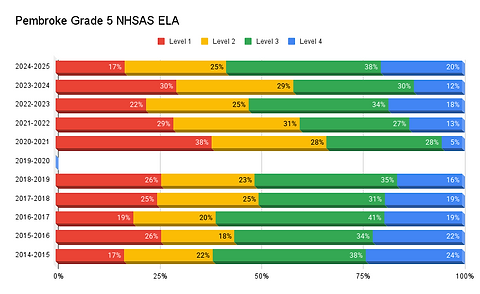
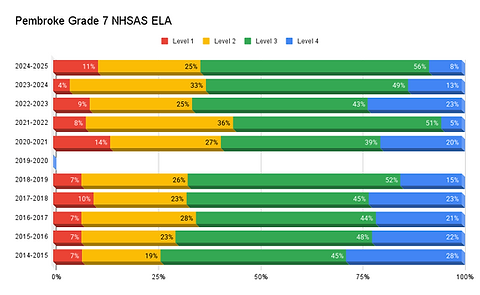
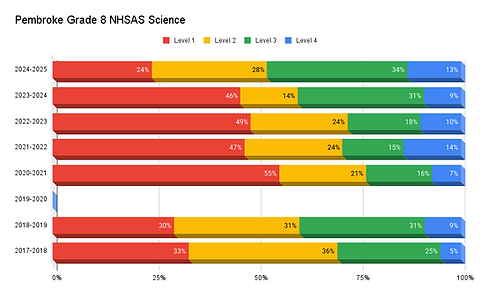
From 2014-2017, the state assessment was the Smarter Balanced (SBAC) test for English and Math. Starting in the 2017-2018 school year, the state moved to the NHSAS testing portal for all official ELA and Math testing for grades 3-8. ELA and Math testing for 11th grade was moved to the School Day SAT with Essay. Science testing was added to grades five, eight, and eleven during the 2017-2018 school year. During the 2019-2020 school year, as testing was scheduled for May, testing was cancelled for all students. (Note that 2020 juniors took their SAT in the fall of 2020, so data is available although does not represent the regular number of takers). The ELA for grades 3-8 testing during the 2023-2024 school year included a new writing component (with a new scoring model). All data is publically available through the iAchieve and iReport portals.
Performance Indicators
Level 1: Not Proficient
The Level 1 student is below proficient in applying the content area knowledge and skills. The student generally performs significantly below the standard for the grade level, is likely able to partially access grade-level content, and engages with higher-order thinking skills with extensive support.
Description from the NHSAS portal.
Level 3: Proficient
The Level 3 student is proficient in applying the content area knowledge and skills. The student generally performs at the standard for the grade level, is able to access grade-level content, and engages in higher-order thinking skills with some independence and minimal support.
Description from the NHSAS portal.
English/Language Arts
.png)
.png)


Level 2: Not Proficient
The Level 2 student is approaching proficient in applying the content area knowledge and skills. The student generally performs slightly below the standard for the grade level, is likely able to access grade-level content, and engages with higher-order thinking skills with some independence and support.
Description from the NHSAS portal.
Level 4: Proficient
The Level 4 student is highly proficient in applying the content area knowledge and skills. The student generally performs significantly above the standard for the grade level, is able to access above grade-level content, and engages in higher-order thinking skills independently.
Description from the NHSAS portal.
Math


.png)
.png)
.png)
.png)


Science

.png)
Assessment Scores By Grade Cohorts
This PDF color codes each graduating class over the years of Assessment Data for the English/Language Arts testing. Although class sizes change, this data gives insight into grade level cohort growth.

This PDF color codes each graduating class over the years of Assessment Data for the Math testing. Although class sizes change, this data gives insight into grade level cohort growth.

This PDF color codes each graduating class over the years of Assessment Data for the Science testing. Although class sizes change, this data gives insight into grade level cohort growth. Please note that this testing did not start until Spring 2018.

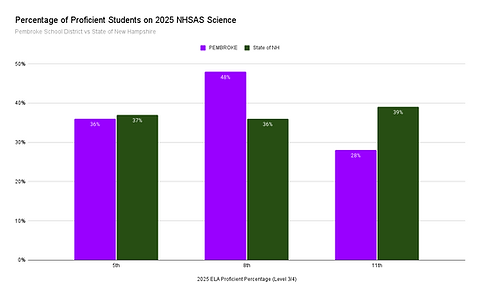
Pembroke Compared
to State of New Hampshire
The following charts compare the test scores from the Spring 2024 testing dates in English Language Arts (ELA), Math, and Science between Pembroke and the State of New Hampshire by grade level.
.png)
.png)
.png)

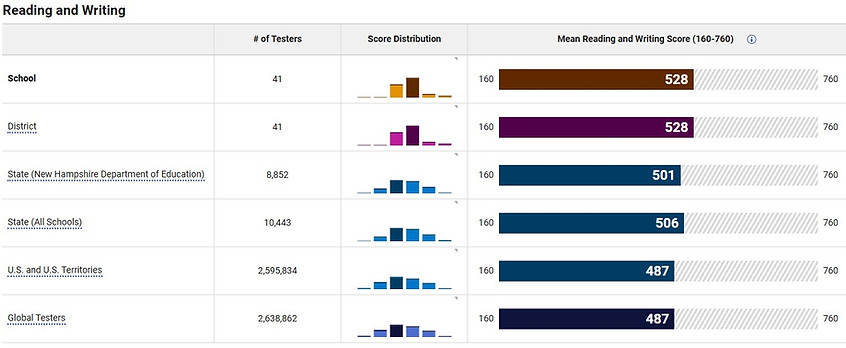
PSAT Results
Pembroke Academy - Fall 2025 - PSAT/NMSQT (41 students)
Each year, eligible juniors are offered the opportunity to take the PSAT in the fall. This is an optional assessment that students can use to practice before the mandatory School Day SAT in the spring.


Pembroke Academy - Spring 2025 - PSAT10 (53 Students)
Each year, eligible sophomores are offered the opportunity to take the PSAT in the spring. This is an optional assessment that students can use to practice before the optional PSAT/NMSQT in the fall of their junior year and the mandatory School Day SAT in the spring of their junior year .


School Day SAT Results
Pembroke Academy - Spring 2025 - School Day SAT (144 Students)
Each year, as part of mandated state testing, Juniors take the SAT during the school day in March/April. This year, the test took place in April.


