Our Schools
Opening Spring 2024, the Allenstown Community School (merged the existing Allenstown Elementary School (grades K through 4) with the Armand R. Dupont School (grades 5 through 8). Allenstown Community School has approximately 348 students total. In iReport, you will see that testing data through Spring 2024 reflects two separate schools. For the final 2025 report, data has merged to show Allenstown Community School as a single entity.
2025 iReport Data from the State of New Hampshire
Allenstown Community School (ACS)
-
Cost Per Pupil: $27,765
-
Total Expenditures: $9,658,275
-
Educators Certified in the Subject: 96%
-
Experienced Educators: 81%
-
Average Class Size: 17.0

Assessment Data: 2014-2025
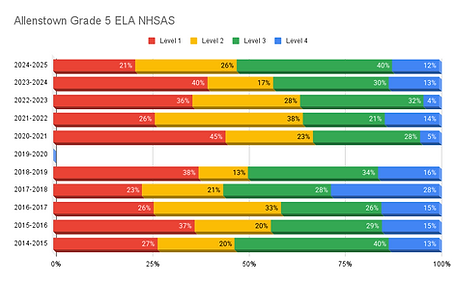
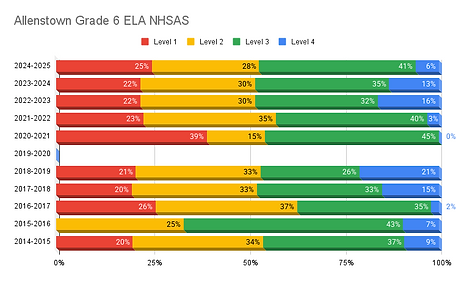
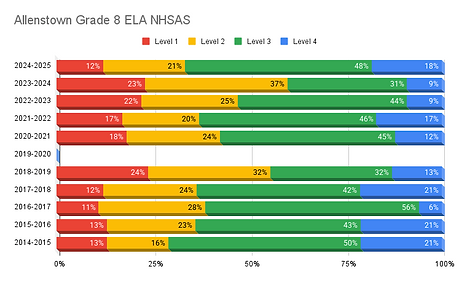
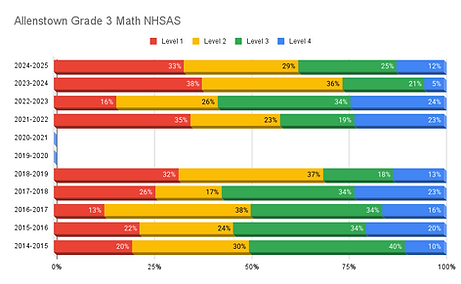
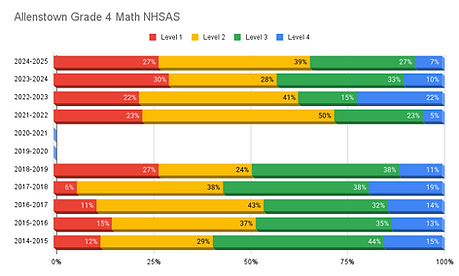
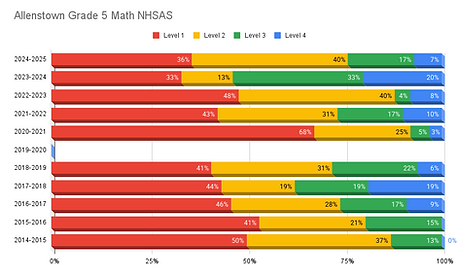
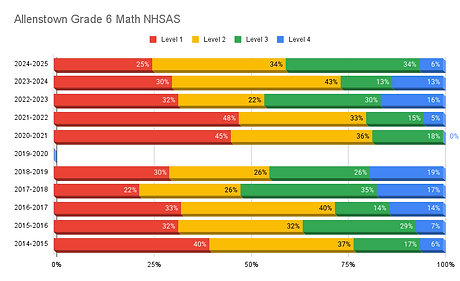
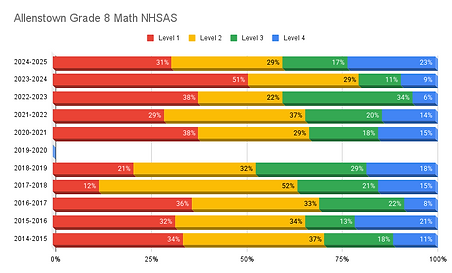
From 2014-2017, the state assessment was the Smarter Balanced (SBAC) test for English and Math. Starting in the 2017-2018 school year, the state moved to the NHSAS testing portal for all official ELA and Math testing. Science testing was added to grades five and eight during the 2017-2018 school year. During the 2019-2020 school year, as testing was scheduled for May, testing was cancelled for all students. There was no elementary state testing done during the 2020-2021 school year in Allenstown. The ELA testing during the 2023-2024 school year included a new writing component (with a new scoring model). All data is publically available through the iAchieve and iReport portals.
Performance Indicators
Level 1: Not Proficient
The Level 1 student is below proficient in applying the content area knowledge and skills. The student generally performs significantly below the standard for the grade level, is likely able to partially access grade-level content, and engages with higher-order thinking skills with extensive support.
Description from the NHSAS portal.
Level 2: Not Proficient
The Level 2 student is approaching proficient in applying the content area knowledge and skills. The student generally performs slightly below the standard for the grade level, is likely able to access grade-level content, and engages with higher-order thinking skills with some independence and support.
Description from the NHSAS portal.
Level 3: Proficient
The Level 3 student is proficient in applying the content area knowledge and skills. The student generally performs at the standard for the grade level, is able to access grade-level content, and engages in higher-order thinking skills with some independence and minimal support.
Description from the NHSAS portal.
Level 4: Proficient
The Level 4 student is highly proficient in applying the content area knowledge and skills. The student generally performs significantly above the standard for the grade level, is able to access above grade-level content, and engages in higher-order thinking skills independently.
Description from the NHSAS portal.
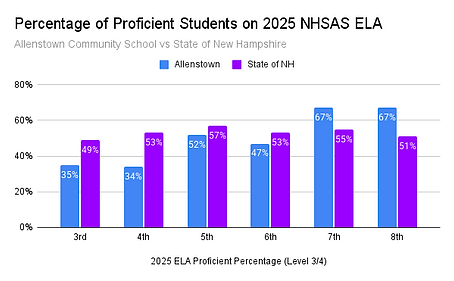
English/Language Arts
.png)
.png)

.png)
.png)
.png)
.png)
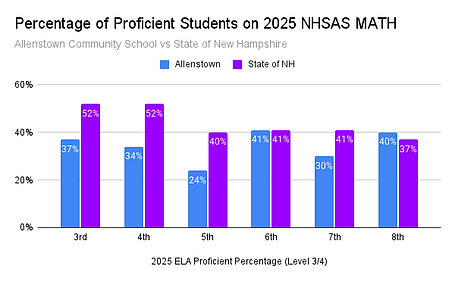
Math

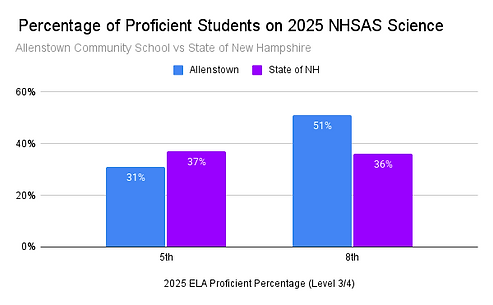
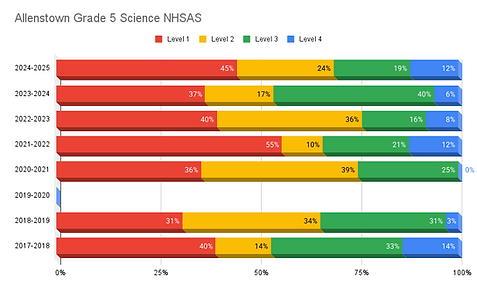
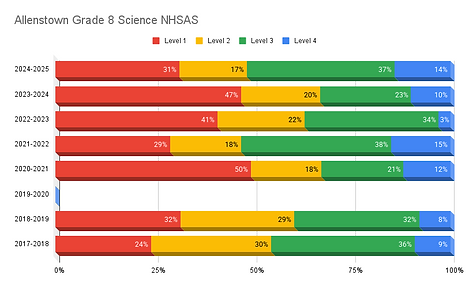
Science
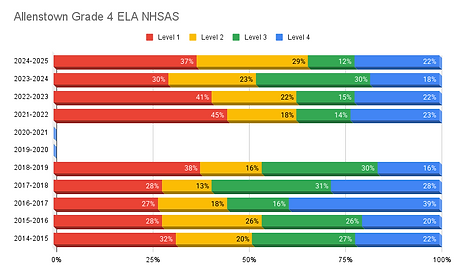
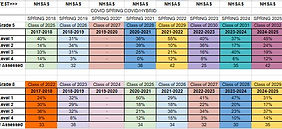
Assessment Scores By Grade Cohorts
This PDF color codes each graduating class over the years of Assessment Data for the English/Language Arts testing. Although class sizes change, this data gives insight into grade level cohort growth.

This PDF color codes each graduating class over the years of Assessment Data for the Math testing. Although class sizes change, this data gives insight into grade level cohort growth.

This PDF color codes each graduating class over the years of Assessment Data for the Science testing. Although class sizes change, this data gives insight into grade level cohort growth. Please note that this testing did not start until Spring 2018.
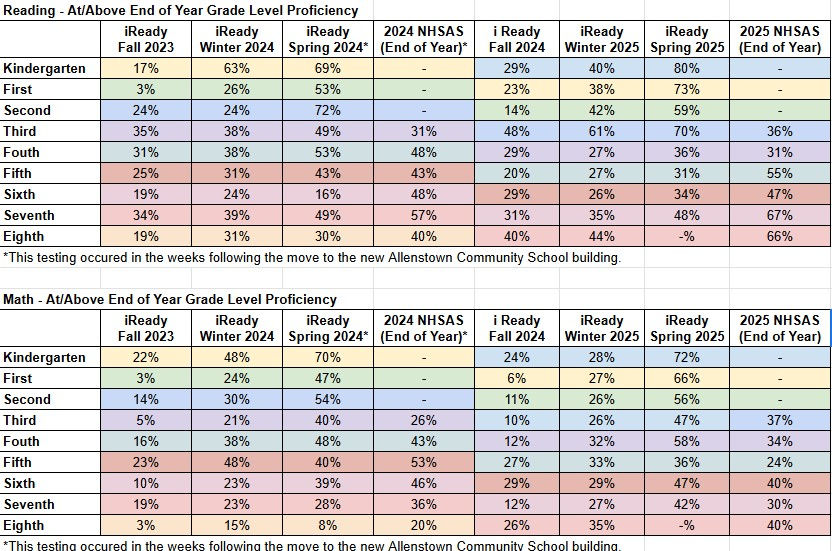
The following charts display where students place on their iReady Diagnostic and NHSAS by cohorts. Please note, the iReady scores are based on where a student should be by the end of the year (so it is to be expected that the Fall scores are low - as students have not yet been taught that information yet).
Allenstown Compared
to State of New Hampshire
The following charts compare the test scores from the Spring 2025 testing dates in English Language Arts (ELA), Math, and Science between Allenstown and the State of New Hampshire by grade level.